orbits
orbits(xyz::Matrix{<:Real}; first=true, radius=6371.007, height=0, lon0=0, lat0=0, show=false, kw...)Plots the orbit, or whatever the input data in xyz represents, about the Earth or other planetary bodies.
xyz: The orbit coordinates. By default, we expect the coordinates in the Earth Centered Earth Fixed (ECEF) system but they can be in spherical coordinates (lon, lat) as well. In this casexyzmust be a Mx2 matrix andheight(the orbit height) must be > 0. If this argument is omitted, we plot a demo spiral "orbit".
radius: The planetary body (spherical) radius. This value may be passed in meters or km and is only used when input is passed in spherical coordinates.
first: Boolean that indicates iforbitscreates the first layer of the image plot. If the default value oftrueis used, we also make a call tocoastto plot the Earth using an Orthographic projection. The default option for this is plot the coastlines only, bur other options, e.g. colorizing the continents, are also available via thekw...arguments. Settingfirst=false, or better, use theorbits!form, skips thecoastcall, which lets this plot be appended to a previous plot as for example the one produced by grdimage on a Eart's DEM. Note, however, that in this case the previous plot must have used the samelon0andlat0otherwise the visible orbit will be wrong.
lon0: Central longitude of the Orthographic projection.
lat0: Central latitude of the Orthographic projection.
height: Used when inputxyzis a Mx2 (lon, lat) matrix and represents the height in meters above the sphere of radiusradius. (MUST be > 0 and not 'too small' or this function's algorithm fails.)
show: Set this totrueif want to see the produced image. Leaving it asfalsepermits adding more elements by posterior plotting calls.
kw: keyword arguments to be consumed in the coast and plot3 calls. For example,land=:tomato, lw=1, lc=:bluepaints the continent with thetomatocolor and plots the orbits with blue, 1pt thick lines.
Examples
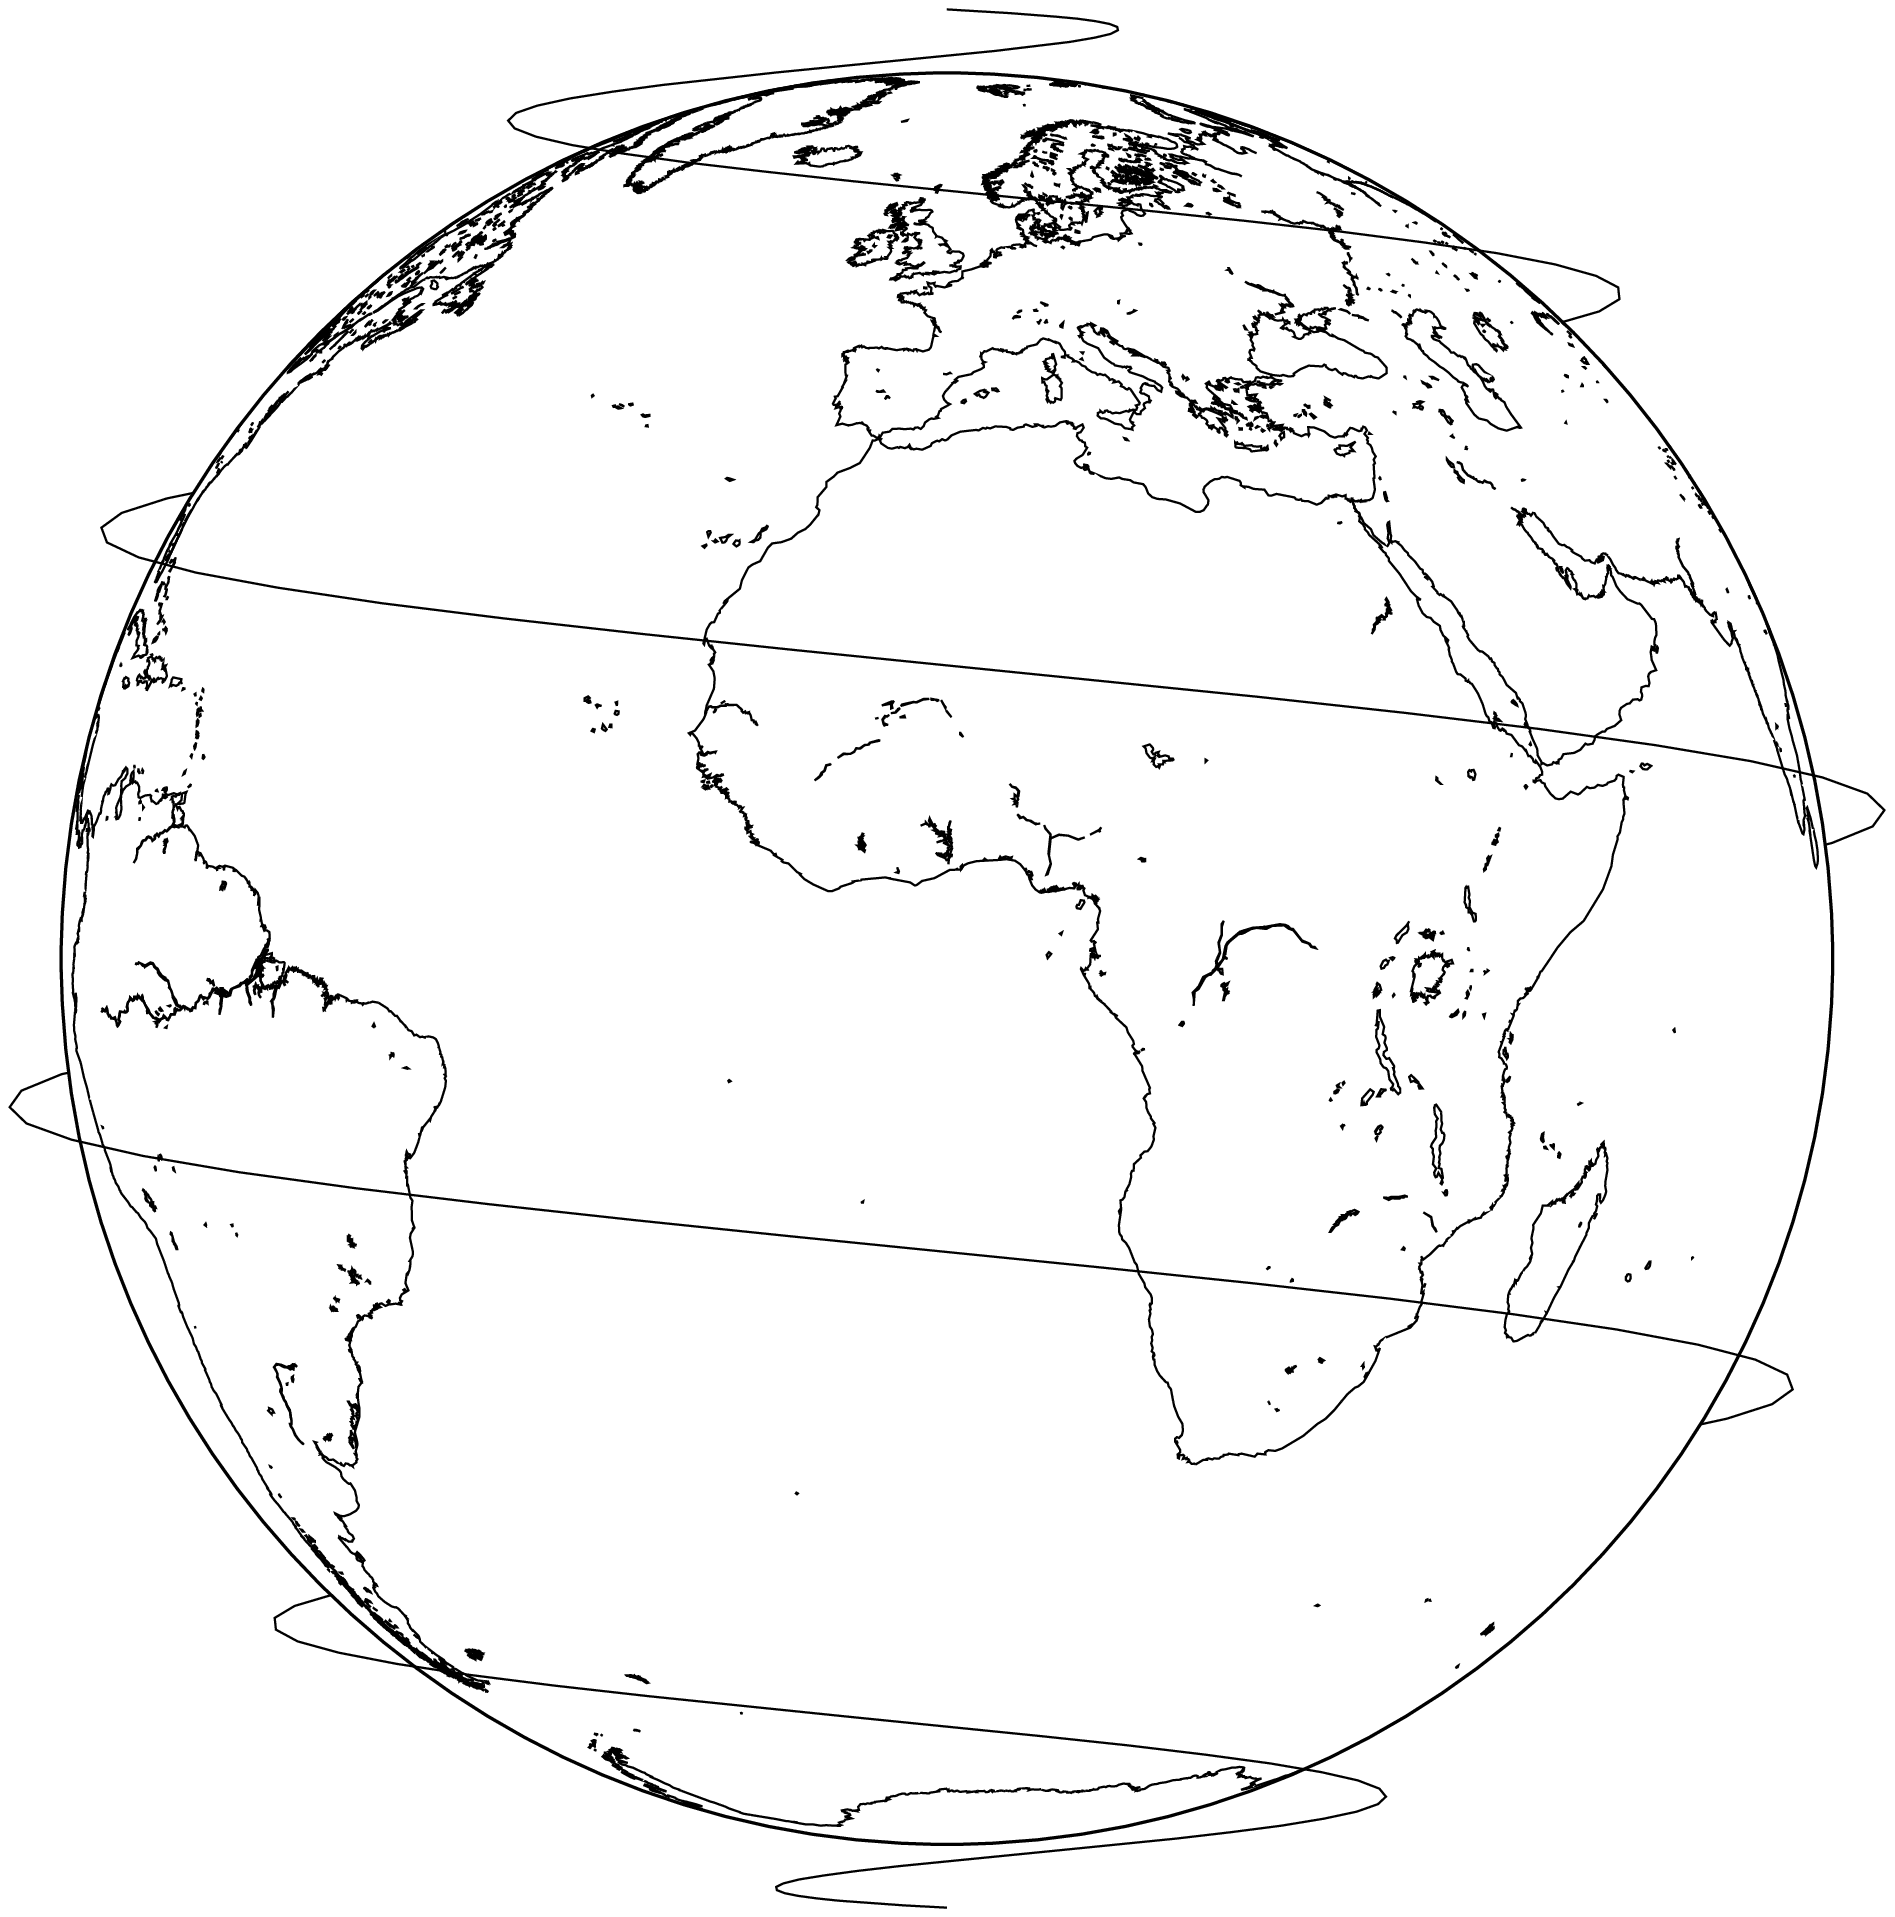
Plot the demo spiral.
using GMT
orbits(show=true)
See Also
These docs were autogenerated using GMT: v1.33.1